Thousands of lives are lost annually in vehicular accidents worldwide. A recent study utilizing data from the National Highway Traffic Safety Administration (NHTSA) has unveiled the most perilous times to drive in each U.S. state, shedding light on factors contributing to the alarming statistics.
According to the Centers for Disease Control and Prevention (CDC), car crashes globally rank as the eighth leading cause of death, and is the number one cause of death in young people aged 5 to 29. In the U.S. alone, an average of 102 fatal traffic accidents occur daily.

The analysis, represented visually by Clunker Junker, points out that the riskiest hours for commuters extend beyond the expected rush hour, depending on the state. The NHTSA data reveals a spike in fatal traffic accidents after 5 p.m., reaching a peak between 9 p.m. and 10 p.m.
Factors contributing to this dangerous timeframe include low visibility at night, glaring headlights, an increased number of cars on the road, and a higher incidence of drunk driving. Additionally, regional geography and weather conditions, such as hills, mountains, rain, snow, and strong winds, play a role in creating hazardous road conditions.
Congestion is another significant factor, with more populated states like California and Maryland experiencing the highest risk during later hours (between 9 p.m. and 10 p.m.), while central states with smaller populations, such as Kansas and South Dakota, face earlier peak dangerous times (between 1 p.m. and 2 p.m.).
Surprisingly, the safest times to drive across all states are early in the morning, from 3 a.m. to 5 a.m.
The study also delves into the most dangerous time to drive by month and day. While holidays are typically associated with relaxation and celebration, they also pose heightened risks on the roads. According to NHTSA data, the summer and fall months record the highest average fatal accidents.
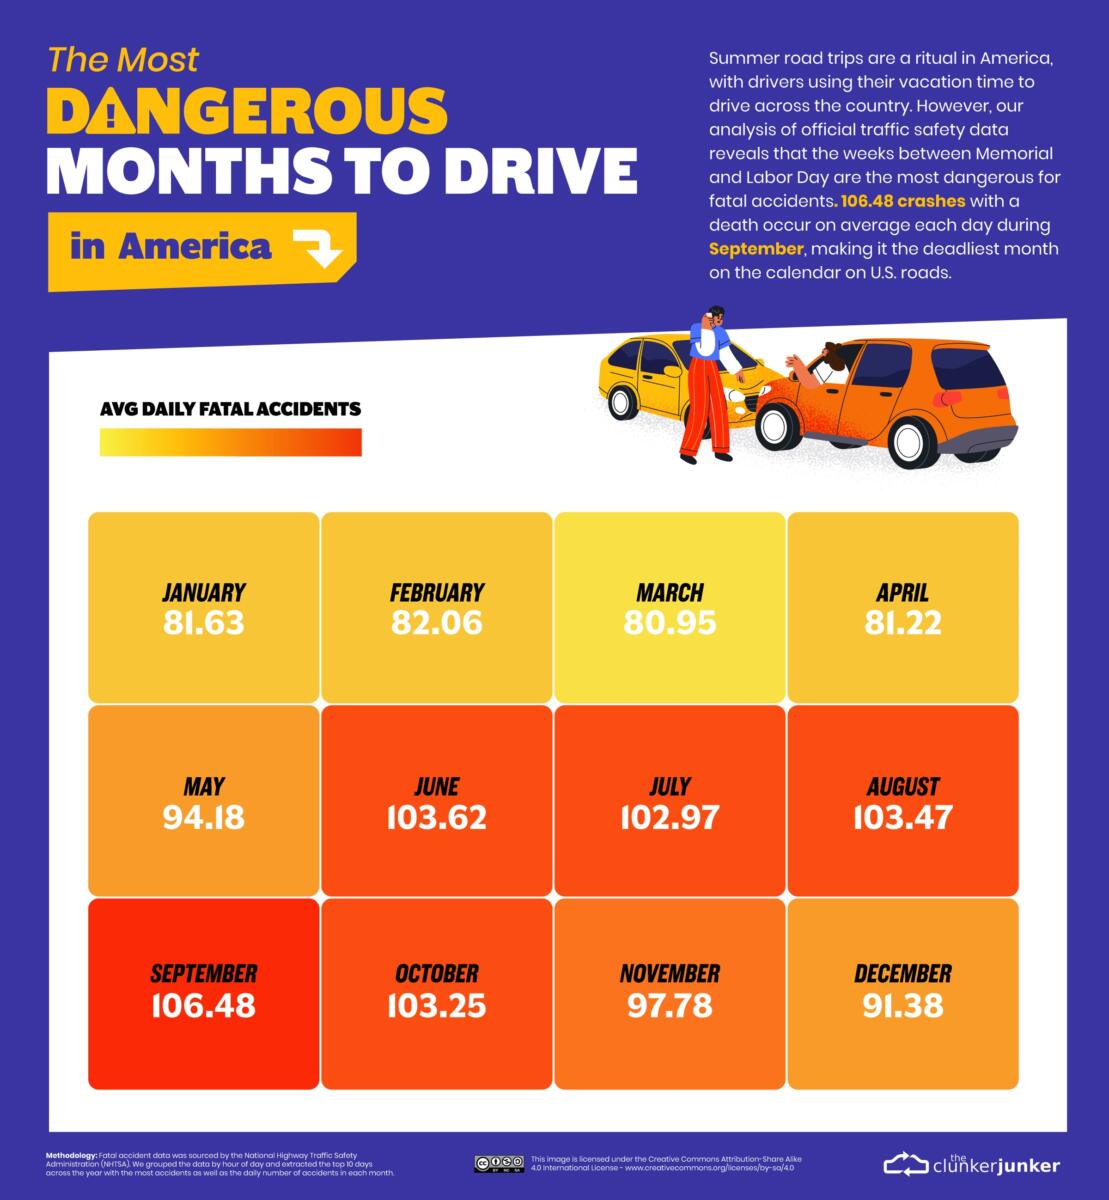
June through August, peak vacation months in the U.S., witness increased traffic on high-speed highways and unfamiliar roads, leading to a rise in fatalities. However, September emerges as the most dangerous month to drive, marked by the Labor Day weekend and the commencement of the new school term, introducing new drivers to the roads.
Popular holidays such as the Fourth of July, New Year’s Eve, and Halloween also register as more dangerous than average, involving increased instances of drinking and driving, as well as long-distance travel leading to driver fatigue.
According to the NHTSA, Saturdays pose the highest risk, with an average of 4.68 fatal accidents, peaking at over seven fatal accidents between 9 p.m. and 10 p.m. every Saturday. The data underscores the need for heightened awareness and caution during these specific timeframes to reduce the alarming toll of fatal traffic accidents across the nation.
##RVT1138b

“Surprisingly, the safest times to drive across all states are early in the morning, from 3 a.m. to 5 a.m.”
You think? Maybe cause nobody is on the road at that time. There is nothing in this study that isn’t common sense. I wonder how much this study cost them.
Having workèd in transportation safety for 37 years, I have noticed that natural circadian rhythms of the body play a large role in fatigue. Not many people consider 1-3 pm a dangerous time.
“Surprisingly, the safest times to drive across all states are early in the morning, from 3 a.m. to 5 a.m.”
Well there are fewer vehicles on the road at that time of day. BIG SHOCKER…
The only accident with damage that I have had was driving home from school about 3 PM. An out-of-town delivery truck made a left turn through me. At least they stopped at impact. 😉
I left for work around 4:25 AM my last few years (2013-2017) working in DC. My motivation was to increase the certainty of the length of my morning commute. It worked on the front end of the day (40-45 minutes), but not the back end (40-90 minutes, depending on accidents, stopped trains, congestion, VIP motorcades, etc.,.). Surprisingly, lots of other drivers were on the road 4:30 – 5 AM between northern Virginia and the National Mall in DC. Thankfully, we never hit one another. 🙂 Thank you, RV Travel! 🙂
I would really like to see the data for each state disaggregated to individual cities or metro areas. That is, how does the Kentucky “dangerous time” for Louisville look relative to that of Bowling Green, Glasgow, Owensboro, Paducah, Lexington, and Richmond? It would be very interesting to see how Atlanta skews Georgia’s number. Ditto for Nashville relative to Tennessee, and what the numbers are for Memphis, Knoxville, Chattanooga, Cookeville, and Jackson.
Vegas versus Alamo, NV at 3:00am?
We have to remember these stats are for an entire state. 3am – 5am isn’t always the safest time to drive. Sure it is the lowest vehicle traffic times – but in rural areas with large wildlife, these critters are often crossing roads in the pre-dawn hours.
Been there, done that!
Good thing I like to time our drives between 9&3. That might only get us into trouble in a few states.