The Spring 2025 edition of RV RoadSigns, the quarterly forecast prepared by ITR Economics for the RV Industry Association, projects 2025 wholesale shipments ranging from 333,400 units to 366,800 units, with a median of 350,100 units.
The RVIA estimated a nearly identical number of shipments last year at this time, with wholesale shipments ending up short by about 16,000 at year’s end.

“After seeing wholesale shipments finish 2024 up seven percent at 333,700 units, we are cautiously optimistic that the industry will see further growth over the course of the year,” said RV Industry Association President and CEO Craig Kirby.
“Interest rates continue to be a challenge, but there are green shoots for the market including continued consumer interest in RVing, creating a positive overall retail environment.”
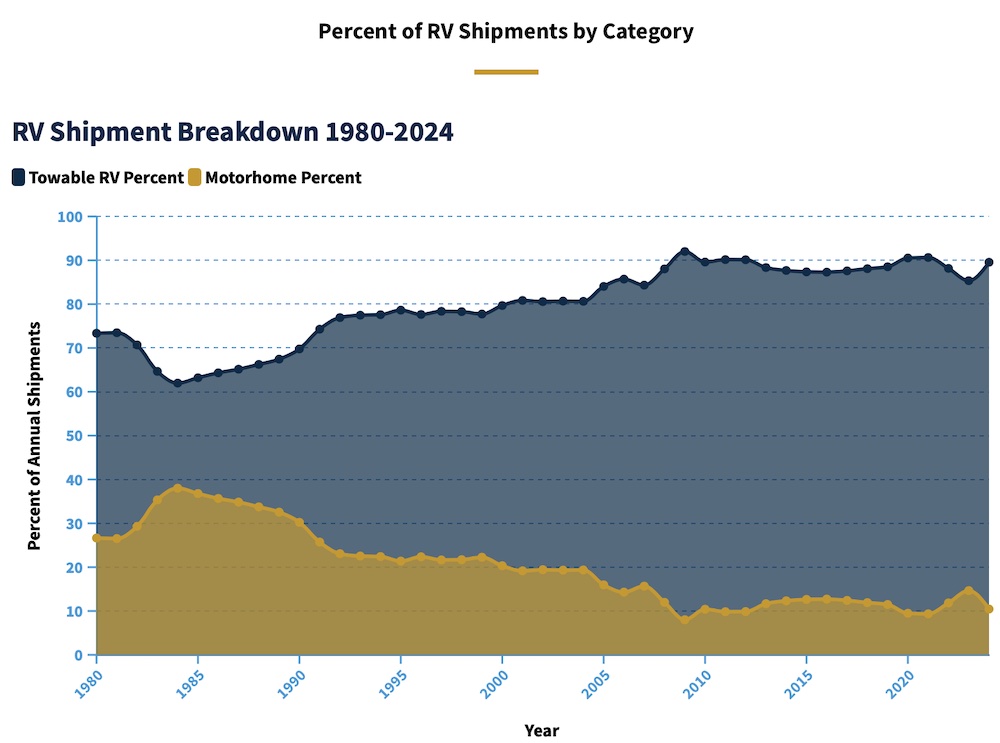
Reaching the 350,100 wholesale unit projection would be a 5 percent increase over the 333,700 unit year-end total. Towable units are expected to total 313,300 units on 4.8% growth, with motorhome shipments gaining 5.5% to 36,800 units. Motorized shipments only represent about 10 percent of all RVs shipped and continue their decline as a percentage of total shipments over past years.
More articles you might really like
• Camping World owes many RVers big refunds.
• Turn any van into a camper in 2 hours for under $500
• California, other states, may soon ban motorhome sales
• RVers on hanging up the keys: ‘It’s just not worth it anymore’
• 10 Secret Buc-ee’s rules nobody tells you about
• RV black tank best practices that work and 2 that failed
• Why is there no industry-wide RV quality control?
##RVT1199b

Thank you for sharing the forecast, RV Travel! Have a great week and safe travels!
I watch about nine motorhome dealerships across the U.S. and my view is that used motorhomes are turning fairly well…many on the lot for 30 days or less. Those same dealers are stocking only a minimum of new ones and some are still sitting on a few new 2023’s!!! Lot rot. The dealers are adjusting.
The percentage chart was interesting, but it would be eye opening to see that same chart with the real volume numbers vs just the % relationship. And on the current chart, why doesn’t it total 100%? What category of RV isn’t represented?
My two cents on the percentage of the industry represented by towables and drivables is that truck campers and park models are the omitted categories, Mikal. But it seems excessive to attribute ~10% of the industry to them.
As an aside, I used RV Trader to get numbers for an RV seminar and their numbers never quite added properly. That is adding their category numbers never quite reached their reported total. Perhaps the 10% includes some RVs that are uncategorized? Safe travels, Mikal!